Definition of 'Evening Star' as per Investopedia.com
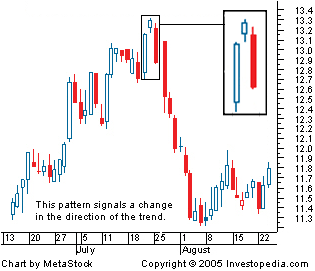
A bearish candlestick pattern consisting of three candles that have demonstrated the following characteristics:
1. The first bar is a large white candlestick located within an uptrend.
2. The middle bar is a small-bodied candle (red or white) that closes above the first white bar.
3. The last bar is a large red candle that opens below the middle candle and closes near the center of the first bar's body.
As shown by the chart below, this pattern is used by traders as an early indication that the uptrend is about to reverse.
 |
| Evening Star by Investopedia.com |
After an advance or long white candlestick, an Evening Star signals that buying pressure
may be diminishing and the uptrend could be nearing an end.
Whereas a security can decline simply from a lack of buyers, continued buying pressure is required to sustain an uptrend. Therefore, an Evening Star may be more significant after an uptrend or long white/green candlestick. Even after the Evening Star forms,further downside is required for bearish confirmation. This may come as a gap down, long black/red candlestick, or decline below the long white/green candlestick's open. After a long white/green candlestick and doji, traders should be on the alert for a potential evening doji star.
Dragonfly Doji
 |
| Dragonfly Doji |
Doji
The Doji is a powerful Candlestick formation, signifying indecision between bulls and bears. A Doji is quite often found at the bottom and top of trends and thus is considered as a sign of possible reversal of price direction, but the Doji can be viewed as a continuation pattern as well.
A Doji is formed when the opening price and the closing price are equal. A long-legged Doji, often called a "Rickshaw Man" is the same as a Doji, except the upper and lower shadows are much longer than the regular Doji formation.
The creation of the Doji pattern illustrates why the Doji represents such indecision. After the open, bulls push prices higher only for prices to be rejected and pushed lower by the bears. However, bears are unable to keep prices lower, and bulls then push prices back to the opening price.
Of course, a Doji could be formed by prices moving lower first and then higher second, nevertheless, either way, the market closes back where the day started.
The chart below of General Electric (GE) stock shows two examples of Doji's:
Inside Day
Investopedia explains 'Inside Day'
An inside day is often used to signal indecision because neither the bulls nor the bears are able to send the price beyond the range of the previous day. If an inside day is found at the end of a prolonged downtrend and is located near a level of support, it can be used to signal a bullish shift in trend. Conversely, an inside day found near the end of a prolonged uptrend may suggest that the rally is getting exhausted and is likely to reverse.
An inside day is often used to signal indecision because neither the bulls nor the bears are able to send the price beyond the range of the previous day. If an inside day is found at the end of a prolonged downtrend and is located near a level of support, it can be used to signal a bullish shift in trend. Conversely, an inside day found near the end of a prolonged uptrend may suggest that the rally is getting exhausted and is likely to reverse.


