Showing posts with label Technicals. Show all posts

Thursday, April 26, 2012

Double bottom made @5161 Expiry jittery,NS may close 5250+

NS Daily Chart
NS formed double bottom at 5161 and retraced to 5210 from 5232-5161.Huge unwinding seen in 5200 puts but as well as unwinding started in 5200 calls. So it shows that NS may go below 5200 but NS has never closed at the low formed hourly except initial 2 hours trade where we saw almost 70 points rally from day high.

NS closed above day pivot 5199 and it may test the resistances @5238(R1) and 5273(week Pivot) and 5310(Monthly Pivot).Staying below 5199 will bring 5165 and 5125.100% rollover done for April series and we can expect an expiry close above 5250.


TT Data has been updated.

Before Trading please see the Golden Rules and TT Data

Wednesday, April 25, 2012

Nifty is still in Hourly oversold territory, 5221 should hold hourly for upmove

NS Daily Chart
Nifty could able to hold and closed above 5221 which is a positive sign. Lot of ITM and OTM PE writing and OI decreasing suggests that Unwinding in puts, market is bullish  but price action still has to confirm in stochastics levels in daily chart but hourly stochastics shows overbought zone and price has not come into breakdown territory.

34DSMA(violet) and 34DEMA(yellow) both are converging which means a bullish breakout. NS closed above daily pivot of 5212 below this market will be weak and still has potential to test 5191-5155-5092 levels. Resistances are ahead at 5243-5264-5276 levels.

TT Data has been updated.

Before Trading please see the Golden Rules and TT Data


Tuesday, April 24, 2012

RSI is still in +ve zone, Stoch has turned down target 5155

Lead indicator has turned down
 RSI level suggests that still it is in positive zone has to enter negative zone. Stochastics levels are suggesting that market has already broke down from overbought zone and turned negative but prices has to confirm. At this point NS will try to defend 5183 which is the lowest of this series so far and breaking of that level will give 5155 a support. NS may test 5092 which is month JNSAR also in this series. But if NS holds day pivot 5233 then more upside is possible up to 5270-75 level. If NS breaks 5183 then 5171(which is the fall from 5430-5171 in past) then a target may be more downwards to 5155-5147-5136-5092.


TT Data has been updated.

Before Trading please see the Golden Rules and TT Data

Tuesday, January 17, 2012

Market may move to 5000 in this week

NF Daily chart

NS has broken the 4880-4900 cluster resistance levels. It will again find some resistance at 4925 level. Breaking of that can lead to 5000 in NS within this week. Because NS has good support at 4825 levels.

Sunday, January 15, 2012

Nifty Outlook for 16th Jan

Nifty Daily Chart
 Stochastics in Daily chart showing as Highly overbought zone. NS has turned up and reached 4899 and retraced back to 4838 and closed at 4866. NS facing heavy resistance @ 4900-4915 level. Important to watch 4820-4804 level. If NS breaches 4800 and decisively breaches 4791 then it may reach to 4751 and from then 4688 level. But if NS holds 4816 on first 2 hours of trade on 16th January, NS may go back to 4911 and then 4937 level.


TT Data has been updated.

Before Trading please see the Golden Rules and TT Data

Friday, January 13, 2012

Sell on Rise in NS as it has closed below 4838

NF Daily Chart
NS has closed below all High EMAs, even it has closed below 4838 which is HEMA daily basis. So SELL On RISE is the mantra. Support for NS will be 4800 and then 4769.NS has closed below Day Pivot of 4835 where 4880 is found as bigger resistance.

Below 4800 more pain for Bulls.


TT Data has been updated.

Before Trading please see the Golden Rules and TT Data

Thursday, January 12, 2012

Nifty forming evening star

NF Daily Chart
As per the candlestick pattern Nifty Future chart shows there is a formation of Evening Star in Daily Chart.
The uptrend is getting exhausted may be lack of buying potentials from buyers. Today the down leg may start and as per Evening Star NS may go down more. Today at the opening selling of all longs (if taken) are suggested.
This uptrend is resisted @50 SMA-4875 and 4882 which is 68% fibonacci retrace from 5099-4531.
Even daily stochastic is also showing Highly Overbought. 9-RSI is also near overbought status.

8-45 am IST Update

Infosys has beat the street expectations in terms of Net Profit and EPS. But as I told yesterday the USD guidance has more importance for the next quarter(Q4) and Infosys has disappointed. I think Infosys will be thumb down by street.


TT Data has been updated.

Before Trading please see the Golden Rules and TT Data


Wednesday, January 11, 2012

Nifty to resist @ 4882

NF Daily Chart
Nifty had a superb rally yesterday. Above 4825 there were no boundaries for NS. But today also the upmove will continue till 4882. Profit has to be booked partially/full. Nifty may come down to 4825-4800 level again. BN and CNX-IT will show the day.

European factor is still visiting back, probable chance of NS to slide to 4588-4562 level on the downside and if Infosys result comes good with stronger USD guidance then NS may go to 5050 level in January.


TT Data has been updated.

Before Trading please see the Golden Rules and TT Data

Tuesday, January 10, 2012

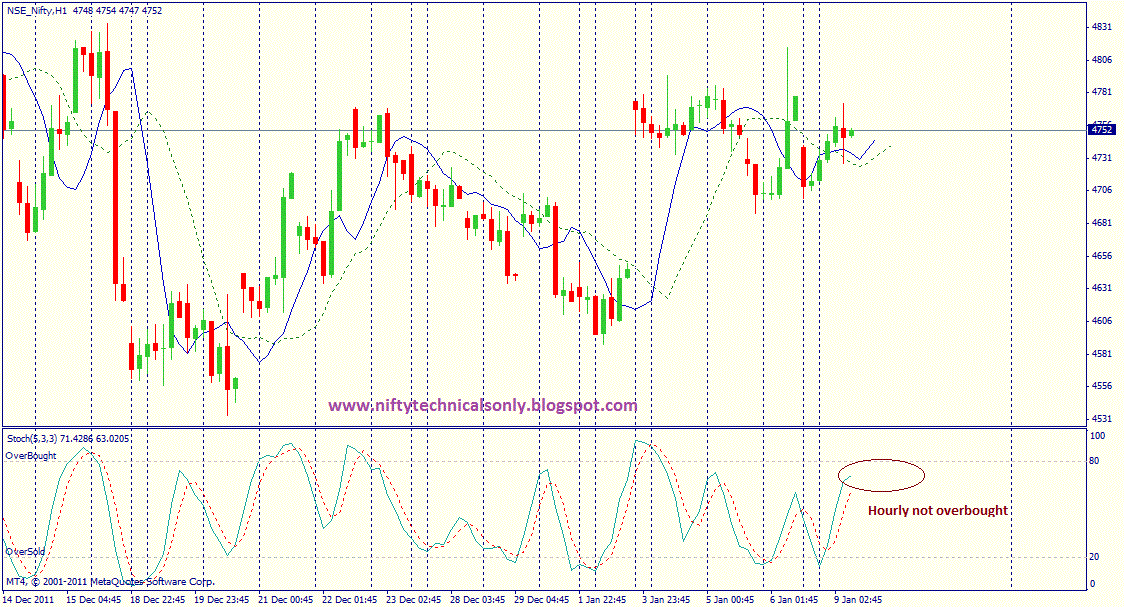
Nifty has to break the cluster of 4765-4692 for direction


NF Hourly Chart
Nifty is in the cluster resistance of 4765-70 to get the direction for more upside. If Nifty is able to break 4765(DHEMA)-4692(DLEMA) range, then Nifty will decisively follow the trend.NS has closed below all High EMAs.

Staying above today's pivot 4732,target will be 4770/4793(R1/R2)
Staying below today's pivot 4732,target will be 4705/4670(S1/S2)


TT Data has been updated.

Before Trading please see the Golden Rules and TT Data

Monday, January 9, 2012

Lackluster trading in Nifty: range is still 4690-4769

NF Daily chart
If resisted below 4780 and trades below 4755, weakness could drag it below 4705 towards 4675 or even 4635. DHEMA for today is 4769 and NS has to break it decisively to go more upside.DLEMA for today is 4690 below that is weakness.

Sometimes in these choppy and sluggish sessions it is advised to trade in Hourly basis moving averages(HEMA) but keep a Stop Loss on the basis of Daily moving averages(DEMA).


TT Data has been updated.

Before Trading please see the Golden Rules and TT Data

Saturday, January 7, 2012

Nifty may show volatile session today with very low volume

NF in Daily chart
Nifty is opened today from 11-00 am to 1-00 pm.
The way 4600,4700 & 4800PE has shoot up from the bottom is not heartening sign for Bulls when Nifty is hardly 40 -50 points below from it’s day Top. There is also addition in OTM puts. NS has also closed below 4769(DHEMA). So sell on close to 4690(DLEMA) still intact.


TT Data has been updated.

Before Trading please see the Golden Rules and TT Data


Friday, January 6, 2012

Nifty in corrective mode

NF Daily Chart
Nifty should hold 4710-20 at the opening hour today. Nifty has closed below 4756(HEMA).
Holding day's gain is the next requirement.
Breaking past 4775-80, hour channel resistance is the next and bulls must do it today to have a decisive continuation of upmove.
"4825" is the daily channel resistance.

12-00 am Update

Question: Can intra longs be initiated with an hourly closing above DLEMA or they shud be treated with repective hourly time frame only i.e. with a close above HLEMA?

Answer: Always have a combination trading system such as:

Week/ Day TA for positional.
Day/ Hour for Short term as well as Intraday.

After Day closed below DHEma, the week/ Day presents a sell on rise but without down momentum as the closes have been above both WLEma & DLEma.

As for Day/ Hour combo, similar sentiments except that Day hasn't triggered a sell by closing below its DEma yet.It could be today.

As the colours in the TT changes, you can feel the strength & weaknesses of different time frame.

As long as the higher T/F is in sell mode, treat the greens in the lower T/F as a ST play only till other "credible reversal patterns & divergences emerge".

2-00 pm Update

4720-25 is big resistance now as it broke today which was working as support for last 2 days.Above that day for bulls.

Book your profit part or full @ 4758 as it is well above DHEMA.

3-30 pm IST Update

Market showed some choppy sessions. I told lower levels of profit booking for longs. Even @4780 level shorts were taken and again booked @4740 level below DHEMA. NS held 4756 at closing basis but there are Out of the money(OTM) active puts bought. So market may need time to break 4786 decisively. No positions carried for overnight.


TT Data has been updated.

Before Trading please see the Golden Rules and TT Data

Wednesday, December 21, 2011

Is Santa back from Honolulu?

Daily Chart
Nifty Chart 21-12-2011


There was a frantic SOS call from Banta which triggered Santa to cut short(prematured) vacation and returning back from Honolulu. Is Santa coming back really?

Nifty closed well above DLEMA(4612) and closed above WLEMA(4689) too. Nifty is well above R2 of 4677 also and daily indicators are turned positive. Nifty has already retraced to 4708 which is 61.8% fibo from 4819 to 4531(Year low) - Again a Golden ratio.Can we see a gap down again as it did same on 5098?

Still to look deeply for more cheers because 4704 is a major resistance and we also closed below DHEMA 4713. Since it is a bear market rally it is better to take profits off the tables instead of overnight positions. Further, nifty is still in downtrend on higher time frame.

But such moves dont come every day.

If holding long - trade with JNSAR tom
If still holding short - trade with JNSAR tom


Still 6 trading days are left for expiry, which is reasonable and NF O.I. below even 1.75 CR.which is very-very rare and abnormal. Nifty trading well above DLEMA , almost 9.75lac put writing in Dec 4600 PE, suggesting now strong support there for series and more surprisingly 100 % i.e.almost 12 lac long addition in Jan 5100 CE is there ,which would be probably hidden indication for market players that Nifty has found a bottom here around 4550 …at least for the short term.
As NF O.I. is on extremely lighter side, and though above said facts are suggesting decent bounce back from here for next series, nevertheless, wise Bulls probably would wait further because when global sentiments and markets are still weak and the trend is down and when they know it very well that they are in a position to easily separate the sheep from the goats, then why shall they unnecessary rollover their long positions at higher level? So probably they will keep themselves quiet and would gather their “mal” @ lower level. In the mean time J10 SAR & JNSAR shall come further down …in their perfect range.. Let us see…

Before Trading please see the Golden Rules and TT Data

Technical Analysis for 21st Dec


Bearish Engulfing Pattern?


Nifty forming a Bearish Engulfing pattern in Daily Chart.

Generally, the bullish candle real body of Day 1 is contained within the real body of the bearish candle of Day 2.
The market gaps up (bullish sign) on Day 2; but, the bulls do not push very far higher before bears take over and push prices further down, not only filling in the gap down from the morning's open but also pushing prices below the previous day's open.
With the Bullish Engulfing Pattern, there is an incredible change of sentiment from the bullish gap up at the open, to the large bearish real body candle that closed at the lows of the day. Bears have successfully overtaken bulls for the day and possibly for the next few periods.

Three methodologies for selling using the Bearish Engulfing Pattern are listed below in order of most aggressive to most conservative:
  1. Sell at the close of Day 2. An even stronger indication to sell is given when there is a substantial increase in volume that accompanies the large move downward in price.
  2. Sell on the day after the Bearish Engulfing Pattern occurs; by waiting until the next day to sell, a trader is making sure that the bearish reversal pattern is for real and was not just a one day occurance. In the chart above of Verizon, a trader would probably entered on the day after the Bearish Engulfing Pattern because the selling continued.
  3. Usually trader's wait for other signals, such as a price break below the upward support line, before entering a sell order. However, in the case of Verizon above, the Bearish Engulfing Pattern occured at the same time as the trendline break below support.

Daily High EMA-4724
Daily Low EMA-4617
JNSAR for 21st Dec 2011==4756
JNSAR for 22nd Dec 2011==4718


Before Trading please see the Golden Rules and TT Data

Tuesday, December 20, 2011

Santa Rally to 5000 in December Series?

Santa Claus has gone to Honolulu for vacation. Since 2 weeks Nifty has seen more declines and broken major support levels. First time in this 2011 Nifty has closed below 4600 mark which is lowest since September 2009.