Thursday, April 26, 2012

Double bottom made @5161 Expiry jittery,NS may close 5250+

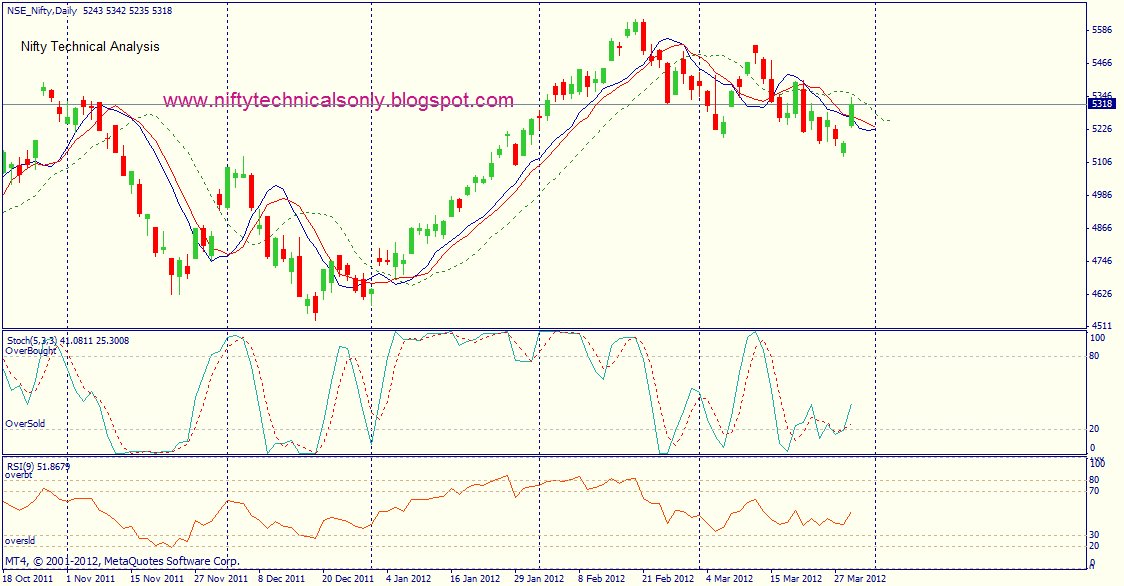
NS Daily Chart
NS formed double bottom at 5161 and retraced to 5210 from 5232-5161.Huge unwinding seen in 5200 puts but as well as unwinding started in 5200 calls. So it shows that NS may go below 5200 but NS has never closed at the low formed hourly except initial 2 hours trade where we saw almost 70 points rally from day high.

NS closed above day pivot 5199 and it may test the resistances @5238(R1) and 5273(week Pivot) and 5310(Monthly Pivot).Staying below 5199 will bring 5165 and 5125.100% rollover done for April series and we can expect an expiry close above 5250.


TT Data has been updated.

Before Trading please see the Golden Rules and TT Data

Wednesday, April 25, 2012

Nifty is still in Hourly oversold territory, 5221 should hold hourly for upmove

NS Daily Chart
Nifty could able to hold and closed above 5221 which is a positive sign. Lot of ITM and OTM PE writing and OI decreasing suggests that Unwinding in puts, market is bullish  but price action still has to confirm in stochastics levels in daily chart but hourly stochastics shows overbought zone and price has not come into breakdown territory.

34DSMA(violet) and 34DEMA(yellow) both are converging which means a bullish breakout. NS closed above daily pivot of 5212 below this market will be weak and still has potential to test 5191-5155-5092 levels. Resistances are ahead at 5243-5264-5276 levels.

TT Data has been updated.

Before Trading please see the Golden Rules and TT Data


Tuesday, April 24, 2012

RSI is still in +ve zone, Stoch has turned down target 5155

Lead indicator has turned down
 RSI level suggests that still it is in positive zone has to enter negative zone. Stochastics levels are suggesting that market has already broke down from overbought zone and turned negative but prices has to confirm. At this point NS will try to defend 5183 which is the lowest of this series so far and breaking of that level will give 5155 a support. NS may test 5092 which is month JNSAR also in this series. But if NS holds day pivot 5233 then more upside is possible up to 5270-75 level. If NS breaks 5183 then 5171(which is the fall from 5430-5171 in past) then a target may be more downwards to 5155-5147-5136-5092.


TT Data has been updated.

Before Trading please see the Golden Rules and TT Data

Monday, April 2, 2012

Below 5269 weakness will be added more

NS Daily chary 02 Apr
Below pivot 5269, there will be more weakness. This week is truncated 3 trading sessions, but NS was in a hurry to catch 5330 last week. SL 5309 intraday for this short.


TT Data has been updated.

Before Trading please see the Golden Rules and TT Data

Friday, March 16, 2012

Two numbers: 5341 and 5402 are important on Budget day

NF Daily Chart
 Today if NS hourly @ 10-00 am closes below 5341 which is R1, then go short and target will be 5268 and on the otherside if NS will close above Day pivot 5402, then go long target 5523. Expect lot of volatility around the day.

Our pragmatic Fin minister should not dissapoint corporates as well as fill the common man's pocket with lot of cash keeping in mind about the fiscal deficit alog with derailed growth of Indian Economy.


TT Data has been updated.

Before Trading please see the Golden Rules and TT Data

Wednesday, March 14, 2012

Gap up possible in Opening 5450 is crucial-below 5392 is downside

NF Daily Chart

Gap up or gap down possibility and therefore a fast Rise and Fast Fall possibility in Hourly chart, when 100 SMA crosses 200 SMA fast rise and 20 SMA crosses 200 SMA then Fast Fall.

NF Hourly Chart

In the above hourly chart 
Green =>200 SMA
Red  => 100 SMA
Blue  => 20 SMA


Tuesday, March 13, 2012

Downside possible if NS breaks 5328

NS Google Chart-Daily

Yesterday was a choppy session. Nifty closed below all Hourly High EMAs. Possible downside if NS closes below 5328 which is yesterday's low and upside possible if NS closes above 5386.
Downside target may be 5304 to 5268 and upside target 5407 to 5455.


TT Data has been updated.

Before Trading please see the Golden Rules and TT Data

Friday, March 2, 2012

Today a gap up opening is expected, trading above 5372 can take NS to 5437

NF Daily Chart
Yesterday Nifty Spot closed at 5340 which was the DLEMA for yesterday. There is high possibility of a gap up opening and NS may open above 5372. If NS will hold 5372 hourly basis then possibility to catch today's JNSAR is very high and NS may touch 5437 also. This correction will be over then and NS may target 5608 within next few trading sessions. SL will be 5340 for this long trade.

Thursday, March 1, 2012

Nifty Spot to retest 5292-5306

NF Daily Chart

Nifty may retrace upto 5306 which is 68%  fibo retrace of 5638-5268


TT Data has been updated.

Before Trading please see the Golden Rules and TT Data

Wednesday, February 29, 2012

Today NS may face stiff resistance at 5403 and go upto 5463 level

NF Daily Chart
Nifty broke the pivot as I told yesterday, that it may reach 5332 level and NS went beyond that and touched the day high at 5391. Nifty closed beyond all EMA on daily basis and closed above the the daily pivot too. If NS sustains this hold of 21-DEMA(5385) then more upside to 5400 and breaking that will take to 5463. I told earlier in previous post that this is not a bear market but just a correction.


TT Data has been updated.

Before Trading please see the Golden Rules and TT Data

Tuesday, February 28, 2012

Today is crucial to save 5257=34DEMA

NF Daily Chart
Today it is crucial for NS to save 5257 which is 34Days Exponential Moving Average. If Nifty able to hold 5257 in the morning session then NS can move up to 5332 which is the Daily Pivot. If you refer my early blog, I have mentioned in earlier post on 22nd February ( http://niftytechnicalsonly.blogspot.in/2012/02/nifty-futures-are-in-very-much.html ) that NS may go down to 5200 level from 5630 level . RSI is still in midpoint, so possibilities are there to go down to oversold level and then a bounce. Below 5257, 5213 can be seen, which is 38% fibo retrace of the rise from 4532 to 5630.


TT Data has been updated.

Before Trading please see the Golden Rules and TT Data

Monday, February 27, 2012

Nifty Spot can go upto 21 DMA 5361

NF Daily Chart
As told last week, this correction can go to 21DMA-5361 zone, and then retrace to day pivot,5452,above this larger retrace to 5461. New low can be made in the opening hour only.
For this type of market one should trade on the basis of HHEMA-HLEMA.

1-00 pm IST Update

NS broke R2=5337 also. Now at EOD saving 5361 is crucial for Bulls. I think today market can not break 5301 or 5288 if it breaks then it is a serious trouble for bulls. Do not go long. You can trade for a small intra bounce to till 5361.


TT Data has been updated.

Before Trading please see the Golden Rules and TT Data

Friday, February 24, 2012

Correction started not a bearish stance

NF forming Bearish Harami in Daily chart


Correction has started and I believe it is not a Bear market rally. This correction can go upto 21SMA=5354. NS closed below JNSAR, please follow the rules for JNSAR below. Today's JNSAR is 5505 and if NS does close hourly basis above JNSAR then go long with a SL of yesterday's low of 5461 and if NS does not close above JNSAR then go short with a SL of 20 points premium to JNSAR.

In NF chart bearish Harami is poised as a Doji with bearish stance. Yesterday's close was expiry of February too which was almost 5480 i.e. weekly 50% FIBO. 5484 is good support line as per 30 min chart(nearly 10 days) 5494 is WEEKLY CAMARILLA L3. Please check calculator page for CAM levels.

2-40 pm IST Update

Nifty spot holding 5410, though it made a low of 5404. But I can not understand this huge premium inNifty Future. Now this level is super buy level I think. Make a SL of 5377.

TT Data has been updated.

Before Trading please see the Golden Rules and TT Data

Thursday, February 23, 2012

Nifty may try to attempt 5561 also which is 61.8% fibo of 5606-5491

NF Daily Chart

Nifty may try to attempt 5561 which is 61.8% fibo retrace of fall from 5606-5491. Above 5561 market may show bull side. Below 5486 shorts will pile up more and the NS may go down below 5450 to 5431. Hopefully there should not be any midpoint crisis in stochastic.


TT Data has been updated.

Before Trading please see the Golden Rules and TT Data

Wednesday, February 22, 2012

Nifty Futures are in very much overbought zone

NF daily Chart

NF is in very overbought zone. The way it rose now it will fall in same severity. As told in earlier post price confirmation will confirm the fall. Nifty may take a chance to check 5630 and then the retrace back to 5200. shorting NF or buying March puts will reward more than risks. Below 5560 more downside to 5532. Expiry is tomorrow so be cautious.


10-30 am Update
Persisting -ve div in Hour ....suggests that this fall will be more than the recent intra corrections.


TT Data has been updated.

Before Trading please see the Golden Rules and TT Data

Friday, February 17, 2012

A bearish Harami in making

Bearish Harami in NF Daily chart
NF in daily chart has made bearish Harami. The first has a large body and the second a small body that is totally encompassed by the first.Harami are considered potential bearish reversals after an advance and potential bullish reversals after a decline. But as per Dow Jones and global market sentiments this uptrend may go upto 5600 and then turn back to protect 5200.

Tuesday, February 14, 2012

Nifty formed Double Doji

NF Daily Chart
The double doji formation is neither a bullish or bearish formation, but represents a condition in which the open and close for the first session are the same, followed by a second session in which the open and close are again the same.
The Doji hints us that the market is in a state of balance of powers: the buyers strength has run out but so is the sellers'. So this is a state of temporary calmness before a major move. This pattern is usually found when both sellers and buyers are exercising the same pressure.
Double doji refers to the equilibrium state in which buyers and sellers are. Thus, typically it can be interpreted as a sure signal that a trend reversal will occur.
Mark the boundaries of theses "double doji" for a confirmed breakout or breakdown.

Today market corrected to 5351 and reached the high of 5421.
Initiate long @ 5340 with Stop Loss Price of 5320. or Initiate short @ 5390 with Stop Loss Price of 5420.
5425 is remaining a stiff resistance but breaking out of that level will take Nifty to 5468-5480. If bullish stands sustains then time to fasten belts. NF can move upto 5556 or fall from 5425 level. SBI good results will also boost BN above 10660.


TT Data has been updated.

Before Trading please see the Golden Rules and TT Data

Monday, February 13, 2012

Nifty rangebound- Resistance 5415-5420

NF Daily Chart
Nifty made a doji on weekly chart and will move rangebound. Below 5363 more downside. People can short at 5425 level with a SL of 5450.

Thursday, February 9, 2012

Nifty forming Inside Day

NF daily chart

'Inside Day'
A candlestick formation that occurs when the entire daily price range for a given security falls within the price range of the previous day. Inside day often refers to all versions of the harami pattern and can be very useful for spotting changes in the direction of a trend.


TT Data
 has been updated.

Before Trading please see the Golden Rules and TT Data


Wednesday, February 1, 2012

Nifty poised hanging man but closed almost 5200

NF Daily Chart

Nifty poised a Hanging man on day before and as per Hanging Man NS was down 120 points day before but yesterday a sharp pull back proved wrong in Nifty. For tomorrow 5165 which is week's pivot has to be saved then NS can move past 5230+